Microsoft Flint vs Alternatives: A New Visualization Language for AI Agents (2026)
Microsoft just released Flint, an open-source visualization language built for AI agents. Here's how it compares to Vega-Lite, D3, and Chart.js.
You’ve asked an AI agent to generate a chart, watched it produce something technically correct but visually embarrassing — tiny axis labels, default colors that fight each other, a legend that overlaps the data — and then spent longer fixing the output than you would have just building the chart yourself. That loop is exactly the problem Microsoft says it built Flint to break.
Flint landed on Hacker News this week as a “Show HN” post from Microsoft’s research team. It’s not a new dashboarding product or a ChatGPT plugin. It’s something more structural: a visualization intermediate language — a layer that sits between what an AI agent specifies and what a charting library renders.
Whether that matters to you depends entirely on whether you’re building with AI agents or just using them occasionally. Let’s unpack it.
The Problem Flint Is Solving
To understand why Flint exists, you need to understand the awkward position current AI agents are in when asked to make charts.
According to the announcement, the team identified two failure modes with existing approaches:
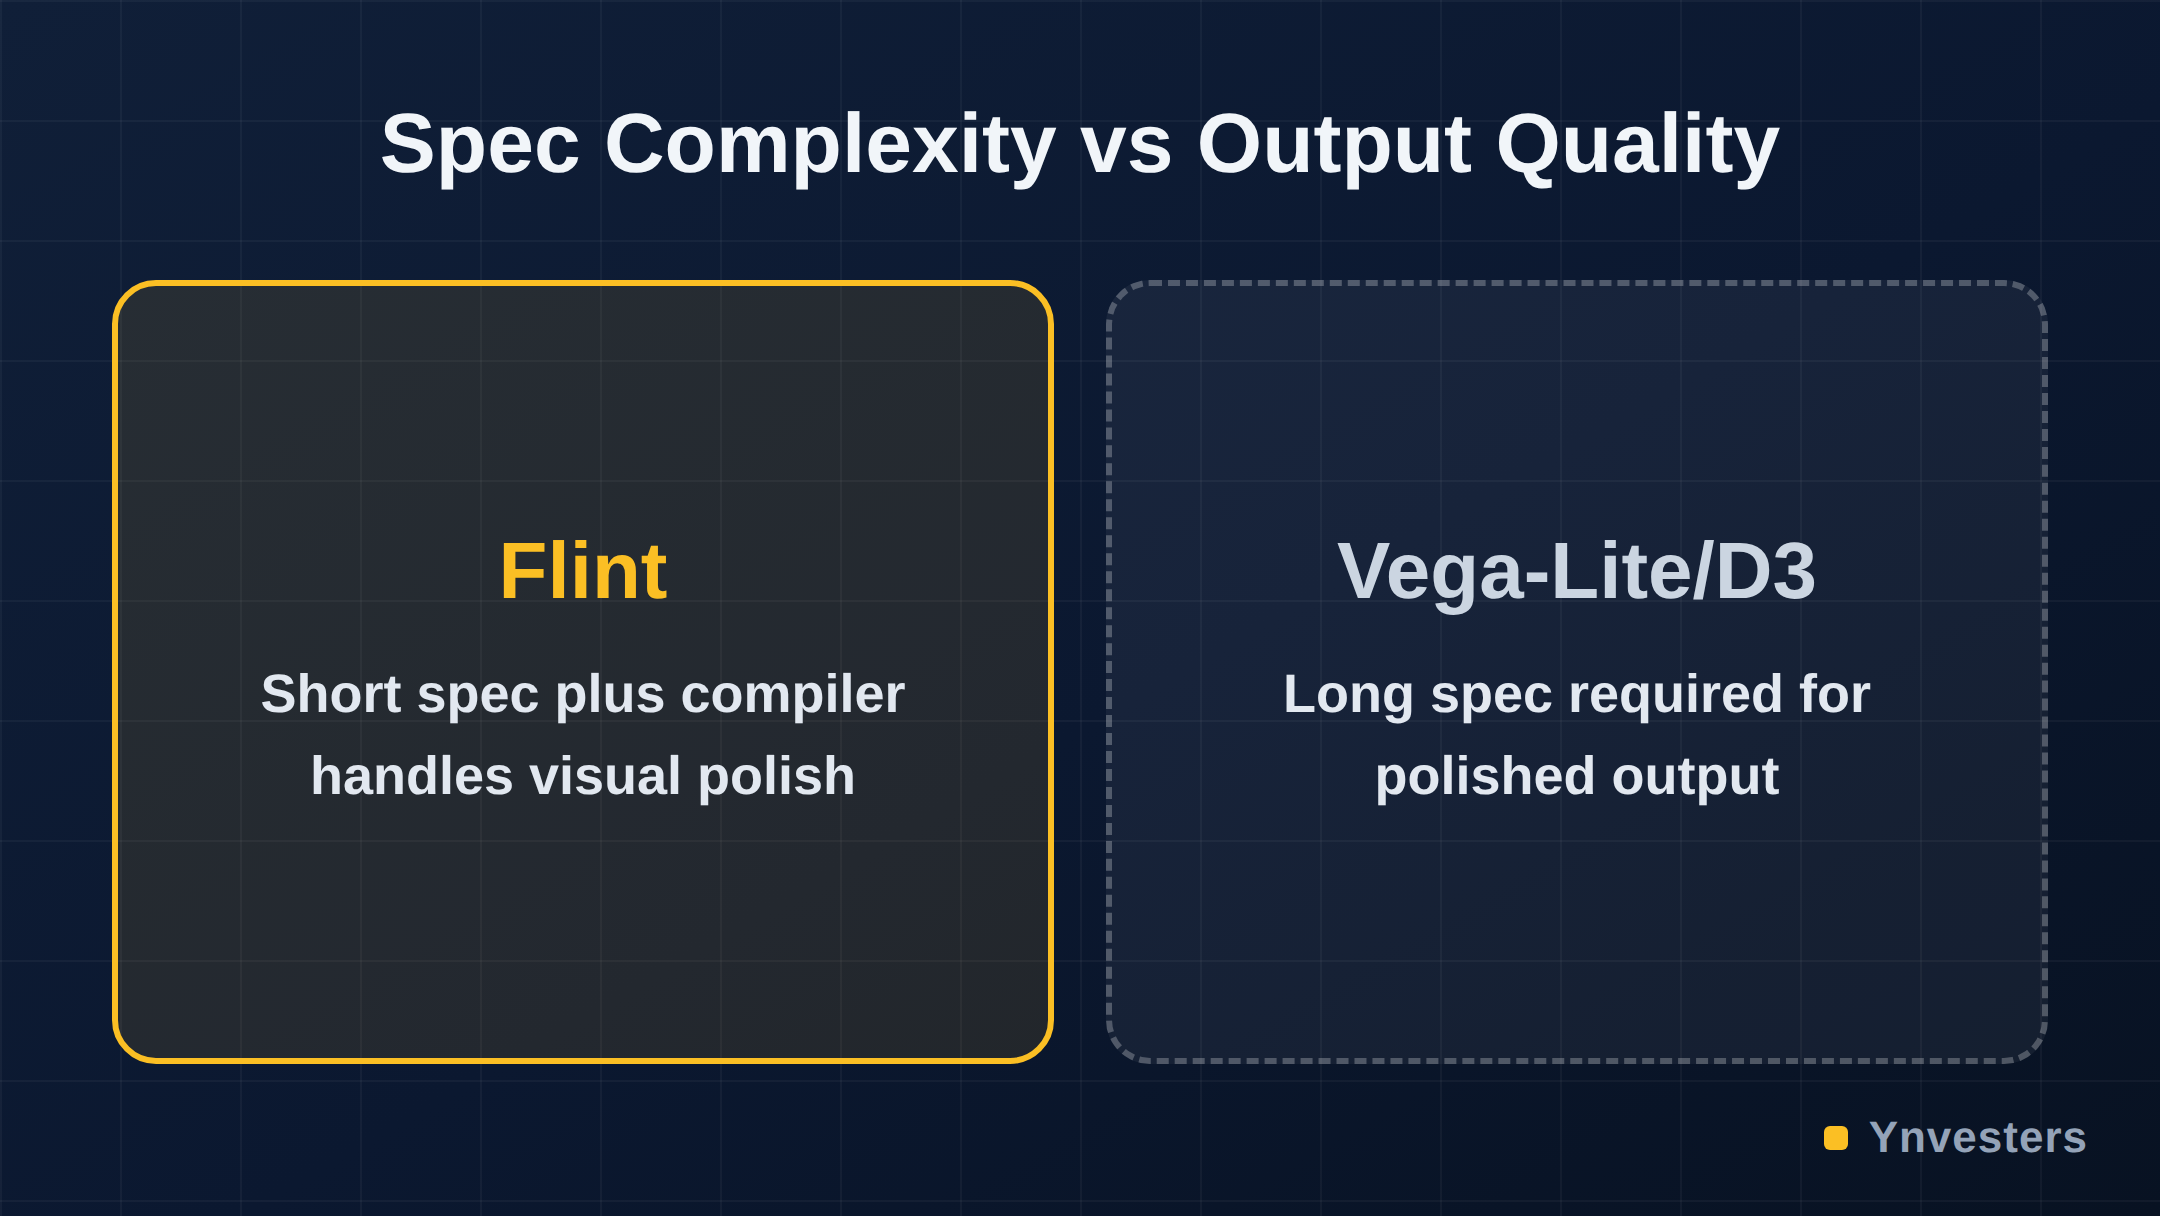
- Simple specs are reliable but ugly. If you ask an agent to produce a minimal Vega-Lite or Chart.js spec, it can do that consistently — but the chart relies on library defaults and often looks unpolished.
- Detailed specs look good but agents struggle to write them reliably. Ask an agent to produce a fully explicit chart spec with custom padding, font sizes, color scales, and axis formatting, and error rates climb. The spec is too long, too precise, and too unforgiving.
The Microsoft team’s diagnosis, per the announcement, is that this is “a limitation on the language issue — not just an AI capability thing.” Current visualization languages were designed for humans who can make aesthetic judgments. They’re too low-level for AI agents, which shouldn’t have to decide pixel-level padding or default font stacks.
Flint’s answer is a semantic-type based specification — agents describe what they want (a bar chart showing revenue by region, with emphasis on outliers) and a layout optimization engine fills in the low-level details to produce something that actually looks good. The spec stays short and reliable; the rendered output gets the polish that usually requires verbose manual overrides.
What Flint Actually Ships With
Based on the official announcement, here’s what’s confirmed:
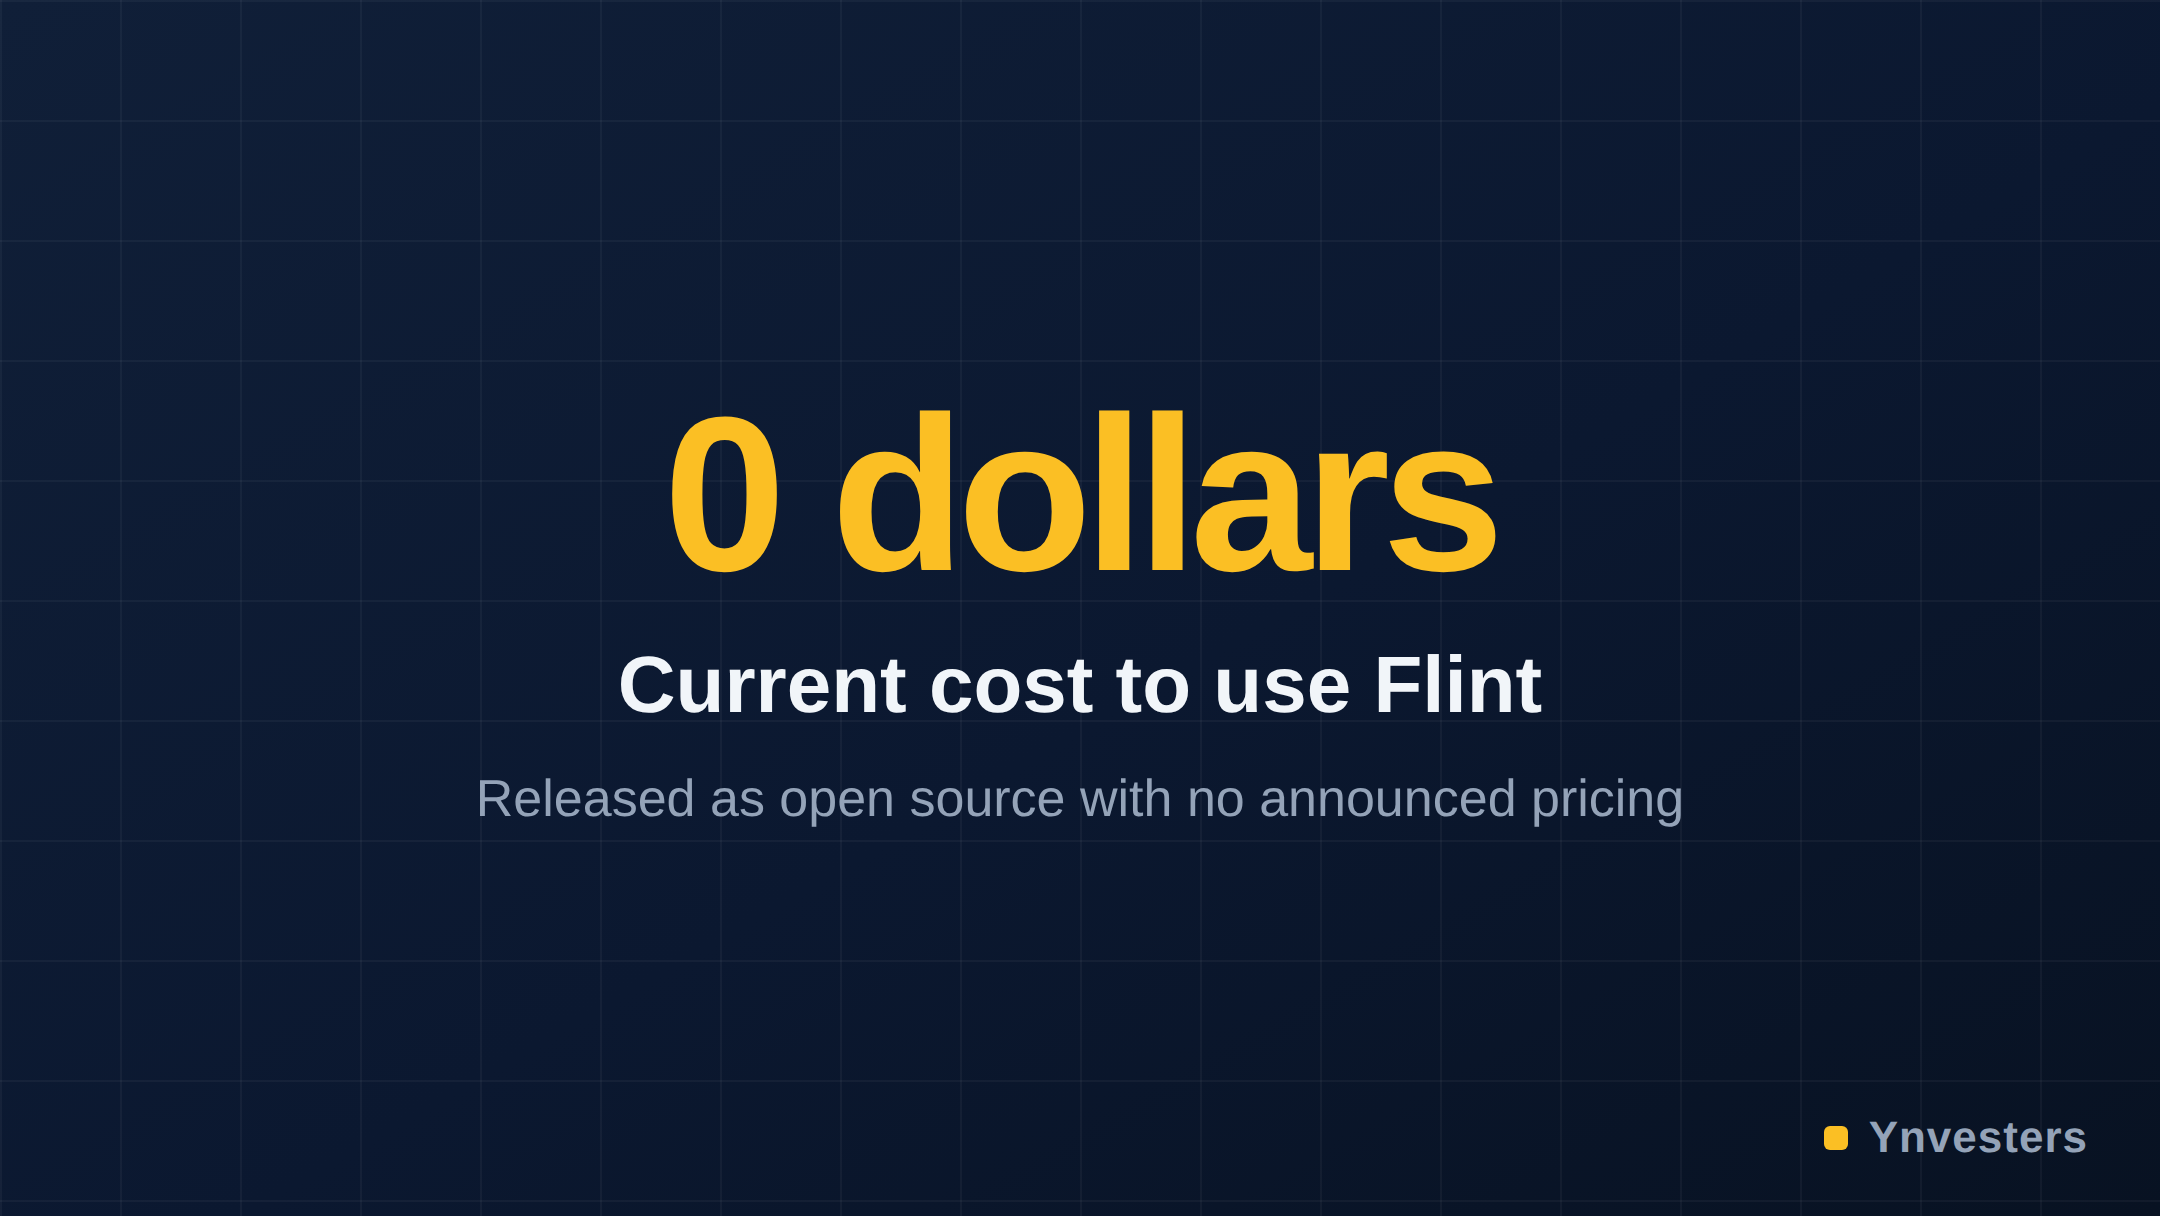
- Open-source release — no pricing has been announced; check the project page for license details.
- An MCP (Model Context Protocol) server — this is practically significant. MCP is the open protocol popularized by Anthropic that lets AI agents call external tools in a standardized way. Flint’s MCP server means you can connect it to Claude Desktop, Cursor, or any other MCP-compatible host without writing custom glue code.
- Integration with Data Formulator — Flint powers Microsoft’s Data Formulator, another open-source project from the same team focused on AI-driven data exploration.
Pricing, enterprise licensing, cloud hosting, and SLA details have not been announced. Treat this as a developer preview until the project page says otherwise.
How Flint Compares to the Alternatives
Here’s where it gets practical. Flint is not trying to replace Vega-Lite or D3 for human developers writing chart specs manually. It’s targeting a specific gap: AI agents generating visualizations programmatically. That changes the comparison significantly.
| Tool | Designed For | Spec Verbosity | AI Agent Reliability | Layout Automation | MCP Support |
|---|---|---|---|---|---|
| Flint | AI agents | Low (semantic) | High (by design) | Yes (built-in engine) | Yes (ships with server) |
| Vega-Lite | Human devs / tools | Medium | Medium (simple specs) | Partial (some defaults) | No (DIY) |
| D3.js | Human devs (custom) | Very high | Low (too imperative) | No | No |
| Chart.js | Human devs (quick) | Low | Medium (limited expressiveness) | No | No |
| Plotly | Human devs / notebooks | Medium | Medium | Partial | No |
A few notes on that table:
Vega-Lite is the closest conceptual predecessor to Flint — it’s a declarative, high-level grammar on top of Vega and it has seen widespread use in AI-assisted data tools like Observable and early versions of ChatGPT’s data analysis mode. But it still expects the author (human or AI) to make explicit decisions about color schemes, axis formatting, and layout. Flint is positioning itself one level higher.
D3.js is the Swiss Army knife of visualization but is deeply imperative. Asking an AI agent to generate reliable D3 code is asking it to write JavaScript programs, not specs. That’s a different and harder problem.
Chart.js is approachable but limited in expressiveness for complex charts. An agent can write it reliably for simple cases but hits a ceiling quickly.
Plotly is worth a mention because it’s widely used in Python data science workflows and has reasonable AI agent adoption via code generation. Verify on their site whether any official MCP or agent-specific tooling exists; as of this writing we’re not aware of a dedicated AI-agent layer comparable to what Flint describes.
Who Should Actually Care About This
You should care if you are:
- Building AI agents or AI-powered applications that need to produce data visualizations as outputs. If your agent pipeline currently calls a charting library directly, Flint could meaningfully improve output quality without making specs harder to generate.
- Using an MCP-compatible agent host (Claude Desktop, Cursor, and others) and regularly asking your AI assistant to visualize data. The MCP server means you can try this in an afternoon, not a sprint.
- Contributing to or extending open-source data tools in the Microsoft ecosystem — especially if you’re already using Data Formulator.
You can safely ignore this for now if you are:
- A solo creator or freelancer whose relationship with charts is “I paste my CSV into ChatGPT and ask for a bar chart.” You’re not the target user and the underlying complexity doesn’t touch you.
- A developer writing chart specs by hand. Vega-Lite, Plotly, or Chart.js remain better choices for human-authored specs because they have years of documentation, community support, and tooling.
- Running an enterprise data team evaluating visualization platforms. Flint is a language and compiler layer, not a BI tool. It’s not competing with Tableau, Power BI, or Looker.
The Bigger Picture: Why Microsoft Is Building This
This isn’t an isolated experiment. Microsoft has been systematically investing in the agent-tool interface layer — from Copilot Studio to the MCP protocol ecosystem. Releasing Flint as open source with an MCP server on day one is a signal that the team wants adoption across the ecosystem, not just inside Microsoft products.
The framing in the announcement — that this is a language problem, not an AI capability problem — is also worth taking seriously. It echoes the logic behind why SQL exists (humans shouldn’t have to write machine code to query data) and why GraphQL was invented (REST was too low-level for what frontend teams actually needed). The bet is that as AI agents become more common data consumers and producers, the tooling layer needs to evolve to meet them where they are rather than forcing them to navigate human-oriented APIs.
Whether Flint specifically becomes that standard, or whether it’s a research artifact that informs something larger, is impossible to say at this stage.
Conclusion
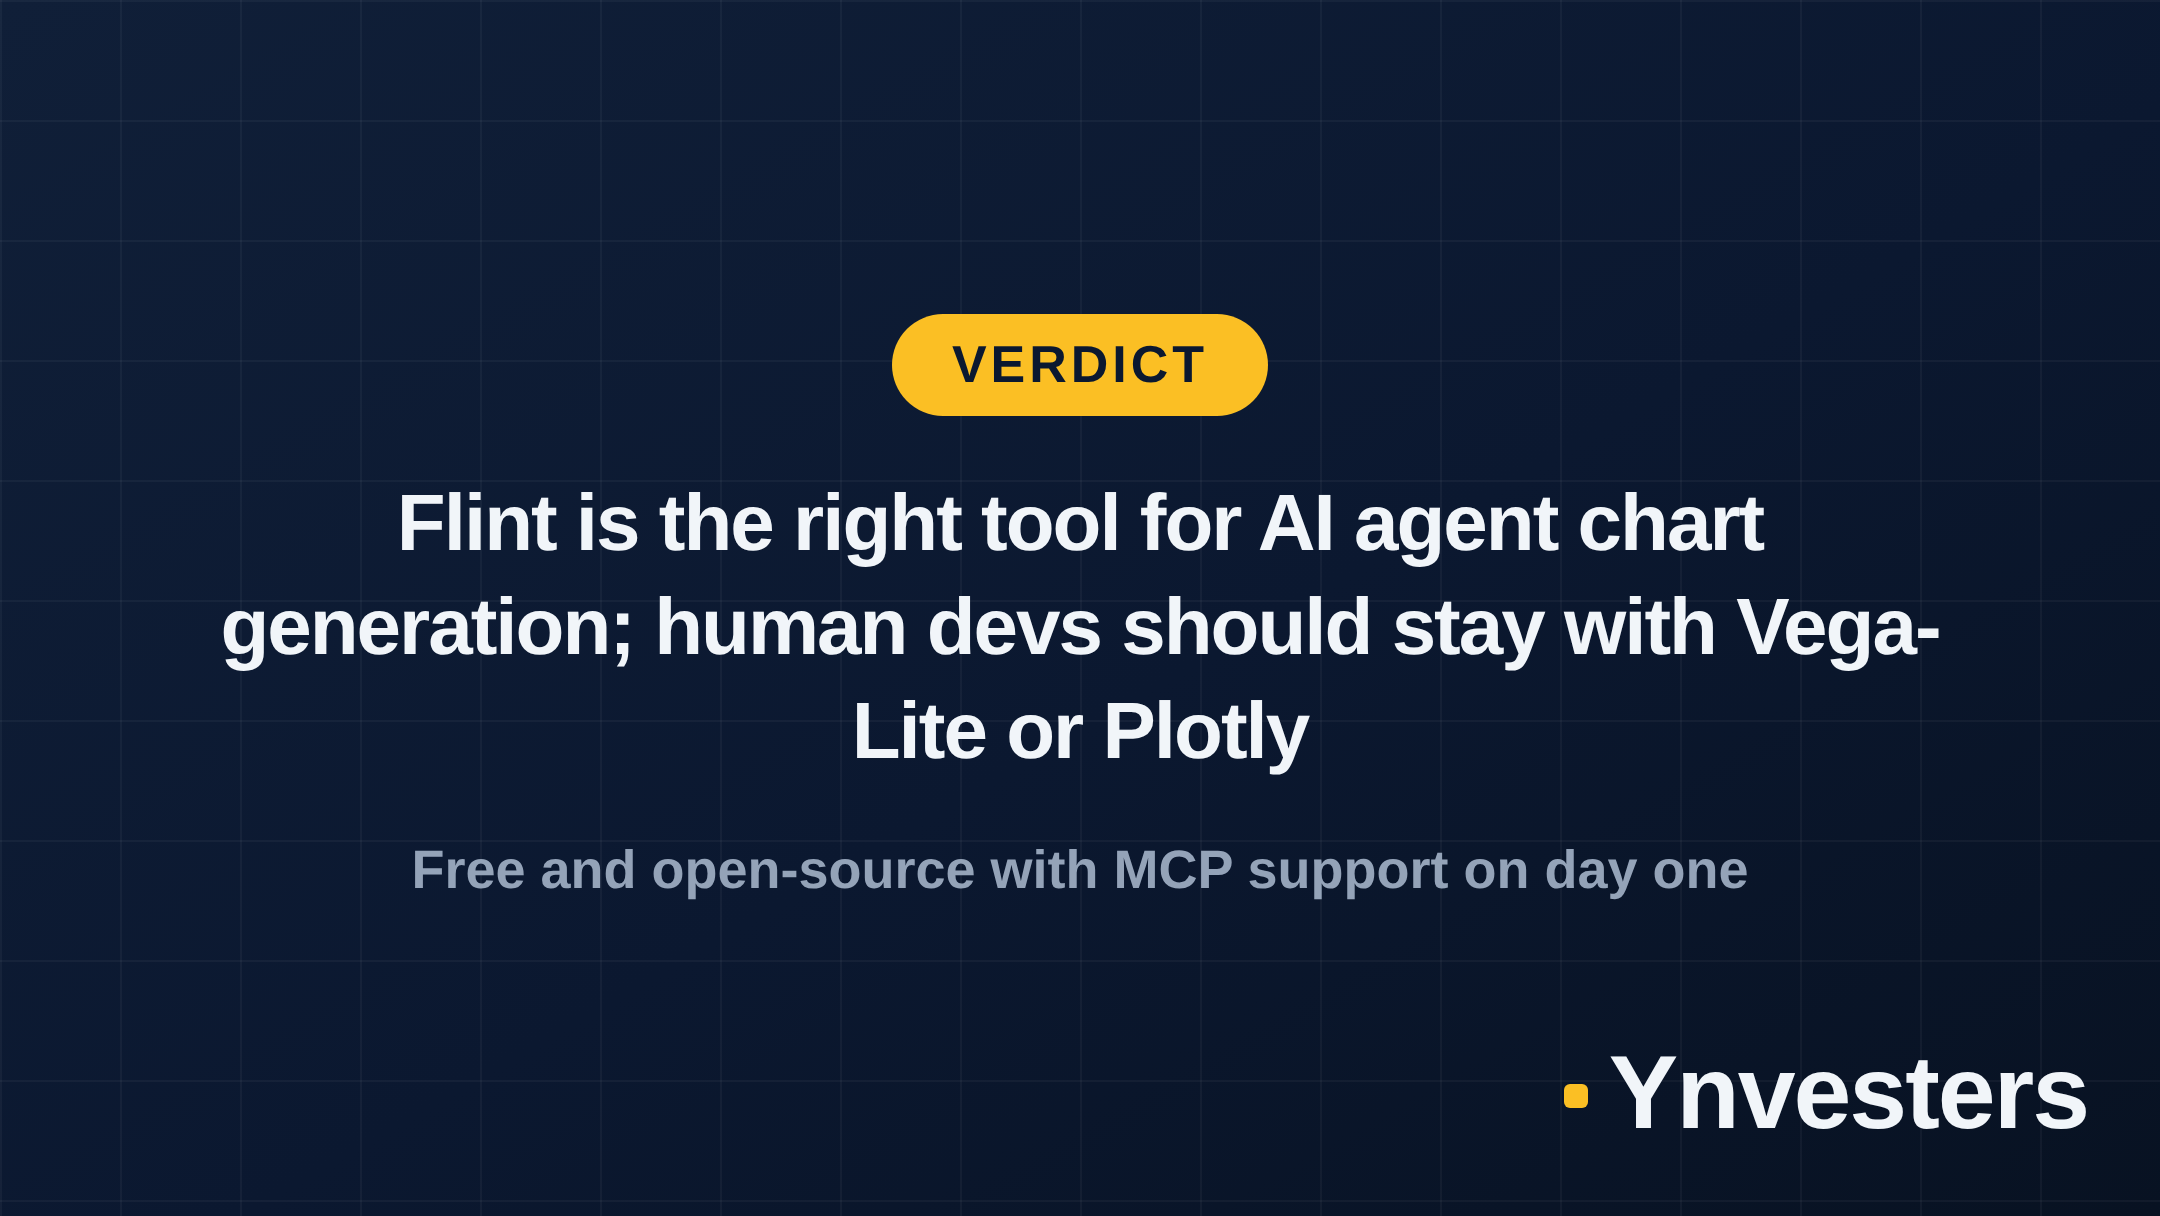
Flint solves a real, specific problem: AI agents generating charts today either produce reliable-but-ugly output or expressive-but-unreliable output. By introducing a semantic-type spec and a layout optimization compiler, Microsoft is betting that the right abstraction level for AI agents is higher than what any existing visualization language offers.
Pay for this? There’s nothing to pay. Flint is open source. The real cost is your time evaluating it.
Use it now if you’re building agent workflows that produce charts, especially if you’re already in the MCP ecosystem. Plug in the MCP server, run it against your current pipeline, and compare output quality. The official project page at microsoft.github.io/flint-chart and the associated Data Formulator project are your starting points.
Skip it for now if you’re not building agent pipelines. The existing charting ecosystem — Vega-Lite, Chart.js, Plotly — remains better documented and more battle-tested for human-authored specifications. Flint is not trying to take that market, and you shouldn’t try to force-fit it there.
The honest summary: this is a technically interesting, well-framed open-source release from a credible team. It doesn’t change anything for most developers today, but it could become infrastructure-level important if AI agent workflows keep proliferating. Worth bookmarking, worth trying if you’re in the target audience, and worth revisiting in six months when community adoption will tell us much more than the launch post can.
Frequently Asked Questions
What is Microsoft Flint and what does it do?
Flint is an open-source visualization intermediate language released by Microsoft. It lets AI agents generate reliable, good-looking charts from simple high-level specs, with a built-in layout engine that handles low-level visual details automatically.
Is Microsoft Flint free to use?
Yes. According to the announcement, Flint is available as open source. No pricing or licensing fees have been announced.
How does Flint compare to Vega-Lite for AI agent workflows?
Vega-Lite is designed for humans writing explicit chart specs; its verbosity causes reliability problems when AI agents generate it. Flint targets AI agents specifically, using a simpler semantic-type spec and a compiler that expands it into full visual detail.
Can I use Flint in my existing AI agent app right now?
Microsoft says Flint ships with an MCP server, so you can plug it into any MCP-compatible agent app — such as Claude Desktop or Cursor — without custom integration work.